
Updated February 2026 with the latest CAC and churn benchmarks.
The average B2B SaaS company churns 3.5% of its customers every month.
Across industries, that number swings from 0.25% for enterprise software to 9.6% for EdTech - a 38x difference depending on who you're selling to.
Below is the full breakdown of churn rates and customer acquisition costs by industry, company size, and acquisition channel, updated for 2026.
At a Glance: 2026 SaaS Benchmarks
| Metric | B2B Average | Best-in-Class |
|---|---|---|
| Monthly churn rate | 3.5% | <0.5% |
| Annual churn rate | ~35% | <6% |
| Average CAC (all channels) | $1,200 | $150 (referral) |
| LTV:CAC ratio target | 3:1 | 5:1+ |
| CAC payback period | 12 months | <6 months |
What Is SaaS Churn Rate and Why Does It Matter?
Churn rate measures the percentage of customers who cancel their subscriptions during a specific time period.
For SaaS companies that depend on recurring revenue, churn directly impacts your ability to grow and maintain financial stability.
There are two types of churn you need to track:
Voluntary churn happens when customers actively decide to cancel. This usually signals issues with product value, pricing, or customer satisfaction.
Involuntary churn occurs due to failed payments, expired credit cards, or billing problems. These customers didn't choose to leave, but technical issues forced them out.
Average SaaS Churn Rates by Industry
Churn varies dramatically depending on your target market and industry.
Consumer-facing products typically see higher churn because switching costs are lower and contracts are shorter. B2B enterprise solutions enjoy better retention due to deeper integrations and longer commitments.
Here's what the data shows across different sectors:
| Industry | Monthly Churn Rate | Annual Churn Rate | Performance Notes |
|---|---|---|---|
| Software & IT (Enterprise) | 0.25% - 0.42% | 3% - 5% | Low switching costs due to deep integrations |
| Software & IT (SMB) | 0.42% - 0.58% | 5% - 7% | Higher due to evolving business needs |
| Healthcare SaaS | 7.5% | ~90%+ | 67% increase from 2024 to 2025 |
| Education Technology | 9.6% | ~115%+ | Customer churn doubled 2024-2025 |
| Financial Technology | 1% | 12% - 24% | Trust and security drive retention |
| Marketing & Advertising | 0.42% - 0.58% | 5% - 7% | Rapid tech evolution impacts retention |
| MarTech (specific) | 6.2% | ~75% | ROI proving challenges |
| HR & Back Office | 4.8% | ~58% | High switching costs after integration |
Key Insights by Vertical
Software and IT companies serving enterprise customers maintain the lowest churn rates in B2B SaaS, between 3% and 5% annually.
These low rates reflect the high switching costs and deep integrations that enterprise software requires. SMB-focused software sees higher churn at 5% to 7% annually as smaller businesses have evolving needs and more flexibility to switch providers.
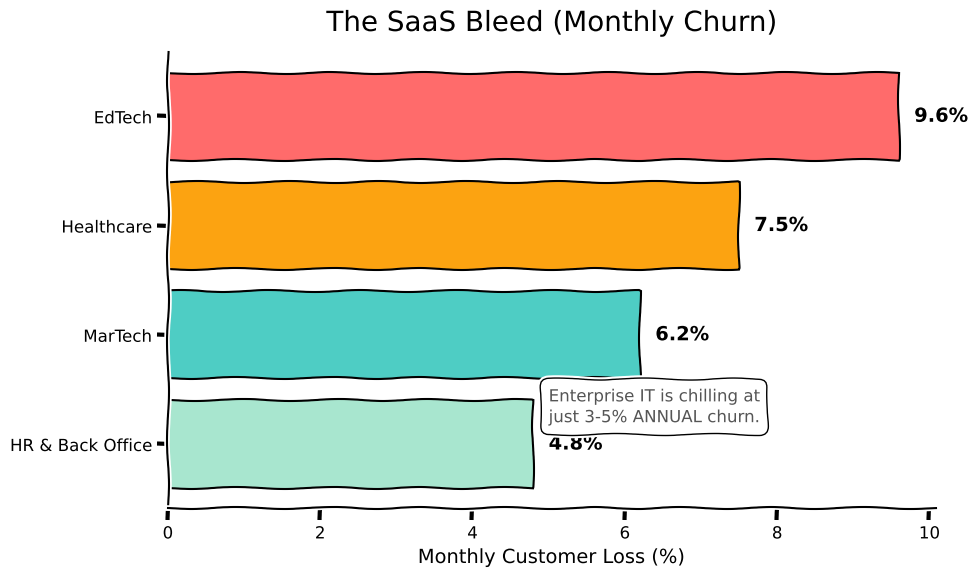
Healthcare SaaS platforms face significant retention challenges with a 7.5% monthly churn rate. The sector experienced a 67% spike in revenue churn from 2024 to 2025, driven by budget pressures and industry consolidation.
Despite these headwinds, healthcare remains a top growth vertical with massive investment in telemedicine and electronic health records.
Education Technology struggles with the highest churn in B2B SaaS at 9.6% monthly. Customer churn doubled from 11% in 2024 to 22% in 2025, reflecting the seasonal nature of education spending, school budget constraints, and rapid technology adoption shifts.
Financial Technology companies report annual churn around 12% for leading platforms, with acceptable performance falling between 15% and 24%. Anything above 28% signals serious problems. Security, trust, and brand reputation matter most in fintech, where customers tolerate higher prices but demand absolute reliability.
Marketing and Advertising platforms typically see 5% to 7% annual churn. The MarTech category specifically shows 6.2% monthly churn, reflecting challenges in proving ROI and rapid competitive evolution that keeps customers constantly evaluating alternatives.
Human Resources and Back Office SaaS maintains a 4.8% monthly churn rate and was the only vertical to accelerate growth from 2024 to 2025. High switching costs after integration into payroll and benefits systems naturally reduce churn in this category.
What Drives Different Churn Rates?
Several factors beyond industry influence your churn rate:
Company maturity plays a huge role. Established businesses with strong brands naturally retain customers better than early-stage startups still finding product-market fit.
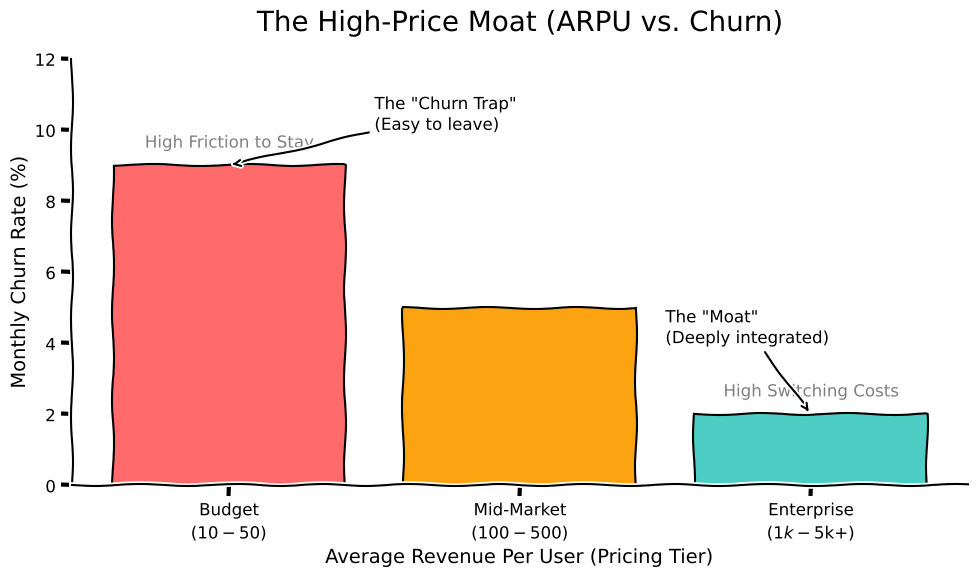
Customer type and contract size create different retention dynamics. Enterprise customers with multi-year contracts rarely churn because switching costs are enormous. SMB customers on month-to-month plans can leave anytime with minimal friction.
Average revenue per user correlates strongly with retention. Companies with higher ARPU typically see lower churn rates. Here's how pricing impacts retention:
| Average Revenue Per User (ARPU) | Monthly Churn Rate |
|---|---|
| $10 or less | 6.2% |
| $25 - $50 | 8.7% |
| $100 - $250 | 7.1% |
The sweet spot appears to be either very low friction pricing (under $10) or premium pricing above $100 where customers perceive higher value and integration costs discourage switching.
Customer Acquisition Cost Benchmarks by Industry
While keeping customers matters immensely, you still need to acquire them efficiently. Customer acquisition cost (CAC) measures the total sales and marketing expenses required to land a new customer.
The formula is simple: divide your total acquisition costs by the number of new customers gained in that period. If you spent $10,000 on marketing in July and gained 100 customers, your CAC is $100.
Overall B2B SaaS CAC Averages
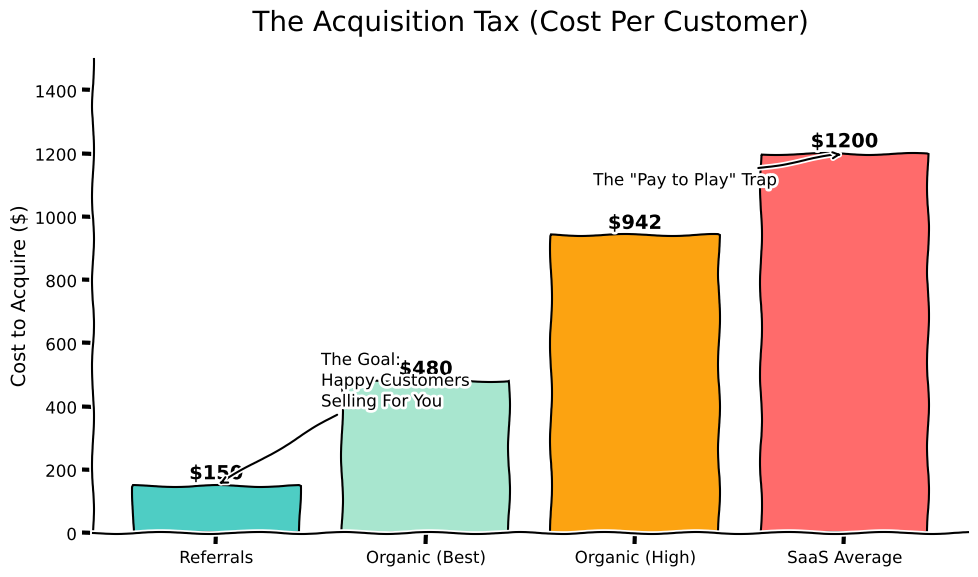
The average B2B SaaS company spends $1,200 to acquire a customer across all marketing channels - up significantly from previous years as acquisition costs rose 14% through 2025.
The median company now spends $2.00 to acquire $1.00 of new ARR, with bottom-quartile companies spending as much as $2.82 per dollar of ARR.
Breaking down by acquisition method:
Organic channels (primarily SEO and content) typically cost between $480 and $942 per customer acquired, with long-term costs potentially dropping to $290 as content compounds over time.
Referral programmes are the most cost-efficient channel at just $150 per customer for B2B SaaS - a strong argument for investing in product experience and customer advocacy.
Paid search delivers an average cost per acquisition of $802 for B2B SaaS, though this varies significantly by competitive intensity and targeting.
CAC by SaaS Industry
Different industries face vastly different acquisition costs based on sales complexity, market maturity, and competitive dynamics:
| B2B SaaS Industry | Average CAC | Key Factors |
|---|---|---|
| Financial Services/Fintech | $1,450 | Regulatory complexity, long sales cycles |
| Higher Education | $1,143 | Multiple stakeholders, lengthy decisions |
| Hospitality | $600 - $900 | Moderate complexity |
| Industrial/Manufacturing | $600 - $900 | Technical evaluation required |
| Healthcare | $600 - $900 | Compliance and security reviews |
| Average (All B2B SaaS) | $1200 | Blended across channels |
| eCommerce SaaS | $274 | Short sales cycles, clear value prop |
| Marketing Agencies | $141 - $200 | Word-of-mouth, industry expertise |
Financial services and fintech carry the highest acquisition costs at approximately $1,450 per customer. The combination of regulatory complexity, security requirements, long sales cycles, and high customer value justifies these elevated expenses.
Higher education comes in second at $1,143 per new customer. The lengthy decision-making process involving administrators, faculty, IT departments, and procurement teams drives up acquisition costs significantly.
eCommerce SaaS enjoys the lowest CAC at just $274 per customer. The straightforward value proposition, short sales cycles, and ability to demonstrate ROI quickly allow these companies to acquire customers efficiently through digital channels.
Marketing agencies benefit from some of the lowest costs in B2B, with CACs as low as $141 in certain segments. Strong word-of-mouth referrals, industry expertise, and trusted relationships reduce the need for expensive paid acquisition.
Detailed B2B SaaS CAC by Industry and Company Size
For industries with reliable data, here's how CAC scales by customer segment:
| Industry | SMB CAC | Mid-Market CAC | Enterprise CAC |
|---|---|---|---|
| eCommerce | $200 - $300 | $250 - $350 | $300 - $400 |
| Education | $900 - $1,100 | $1,000 - $1,200 | $1,100 - $1,300 |
| Fintech | $1,200 - $1,400 | $1,300 - $1,500 | $1,400 - $1,600 |
| Healthcare | $500 - $700 | $700 - $900 | $900 - $1,100 |
| Hospitality | $500 - $700 | $700 - $900 | $900 - $1,100 |
| Marketing Agency | $100 - $200 | $150 - $250 | $200 - $300 |
CAC for industries like Adtech, Construction, and Manufacturing varies significantly by deal size and sales motion. If your vertical isn't listed, use the company size table below as your primary reference.
CAC by Company Size
Acquisition costs scale significantly with your target customer segment:
| Customer Segment | Typical CAC Range | Sales Cycle | Key Characteristics |
|---|---|---|---|
| Small Business | $100 - $400 | 1-3 months | Self-service possible, shorter cycles |
| Mid-Market | $400 - $800 | 3-6 months | Sales team required, moderate complexity |
| Enterprise | $800 - $2,000+ | 6-18 months | Complex sales, multiple stakeholders |
Small business customers cost less to acquire because deal sizes are smaller, sales cycles are shorter, and buying decisions involve fewer stakeholders. Many small business SaaS products can rely on self-service trials and digital marketing.
Mid-market customers require moderate investment with CACs in the middle range. You'll need a proper sales team, product demonstrations, and more sophisticated marketing, but deals aren't yet complex enough to require extensive enterprise sales infrastructure.
Enterprise customers demand the highest acquisition costs. Enterprise deals involve multiple stakeholders, lengthy evaluation periods, security audits, legal reviews, custom contracts, and proof-of-concept implementations.
The Critical Relationship Between CAC and LTV
Your customer acquisition cost only makes sense in relation to customer lifetime value (LTV). LTV represents the total profit a customer generates throughout their relationship with your company.
The standard benchmark across B2B SaaS is a 3:1 LTV to CAC ratio. You should generate at least three times your acquisition cost from each customer to ensure profitability and sustainable growth.
If your LTV to CAC ratio falls below 3:1, you're spending too much to acquire customers relative to their value. Above 5:1 suggests you might be underinvesting in growth and missing market opportunities.
Good Churn Rate Targets for 2026
Understanding what constitutes good performance helps you set realistic goals. Here are the accepted benchmarks based on your company stage and target market:
| Company Stage/Type | Monthly Churn Target | Annual Churn Target | Performance Level |
|---|---|---|---|
| Best-in-Class B2B SaaS | <0.5% | <6% | Excellent |
| Established Enterprise SaaS | <0.58% | <7% | Good |
| General B2B SaaS | <1% | <12% | Acceptable |
| Early-Stage (<$1M ARR) | 0.67% | ~8% | Good for stage |
| SMB-Focused SaaS | 0.42% - 0.58% | 5% - 7% | Expected |
| Enterprise-Focused | 0.25% - 0.42% | 3% - 5% | Expected |
Monthly churn below 1% is considered excellent for B2B SaaS. This translates to an annual churn rate under 12%, which allows for healthy compounding growth and demonstrates strong product-market fit.
Annual churn below 5% represents the gold standard for established SaaS companies. If you're hitting this target consistently, your product delivers clear value and your customers view you as mission-critical to their operations.
Early-stage companies should expect higher churn rates initially. If you're below $1 million in ARR, annual churn around 8% is quite good. As you refine product-market fit, improve onboarding, and build customer success processes, you'll naturally see improvement.
Enterprise-focused products should target even lower rates. Large enterprise customers sign multi-year contracts and integrate deeply into their operations, so annual churn above 7% signals problems with value delivery, customer success, or competitive displacement.
How Economic Conditions Impact These Benchmarks
The 2025-2026 environment has fundamentally shifted how SaaS companies think about growth. Customer acquisition costs rose 14% through 2025 while overall growth slowed - creating an efficiency squeeze that's separating sustainable businesses from those running on fumes.
SaaS spending per employee has jumped significantly, while SaaS-specific inflation runs four times higher than general market inflation. This cost pressure forces companies to scrutinise every software investment more carefully.
The most important shift heading into 2026: existing customers now generate 40% of new ARR across B2B SaaS - and over 50% for companies above $50M ARR. That means retention isn't just a defensive metric anymore, it's a primary growth engine. Companies with Net Revenue Retention above 106% grow 2.5x faster than those below that threshold.
Strategies to Improve Your Numbers
Once you understand where you stand relative to these benchmarks, you can take action to improve both retention and acquisition efficiency.
Reducing Involuntary Churn
Start with the low-hanging fruit. Implement automated card updaters, smart retry logic, and dunning workflows to prevent payment failures. These technical fixes alone can recover significant revenue without any change to your product or service.
Improving Customer Onboarding
The first 90 days determine whether a customer stays long-term. Create a clear welcome journey that demonstrates value quickly. Track engagement during onboarding and proactively reach out when you notice low usage patterns.
Segmenting by Value
Not all customers are equal. Analyze your churn by customer segment to identify patterns. If small business customers churn at 10% while enterprises churn at 2%, you can adjust your customer success resources accordingly or rethink which segments you target for growth.
Optimizing Your Acquisition Mix
If your CAC seems high relative to industry benchmarks, examine your channel mix. Organic channels require patience but typically deliver better long-term unit economics. Paid channels provide faster results but need constant optimization to remain efficient.
Testing pricing models, refining your ideal customer profile, and improving sales conversion rates can all meaningfully reduce acquisition costs without cutting marketing spend.
Using These Benchmarks Effectively
Benchmarks provide context, but they're not targets in isolation.
A healthcare SaaS company shouldn't panic about 7.5% monthly churn if that reflects industry reality and their LTV still supports healthy unit economics.
Instead, use these numbers to identify concerning trends early. If your churn is climbing while industry benchmarks improve, that signals a problem with your product or customer success efforts. If your CAC is twice the industry average, you need to examine your go-to-market strategy.
The most successful SaaS companies obsess over these metrics but focus on the trends more than the absolute numbers. Are you improving quarter over quarter? How do your cohorts compare? Which customer segments show the best combination of low churn and efficient acquisition?
Those questions matter more than whether you hit some arbitrary industry average.
Churn rates and customer acquisition costs vary dramatically across B2B SaaS industries. Understanding these benchmarks helps you set realistic goals and identify areas for improvement in your business.
The average B2B SaaS company sees 3.5% monthly churn and spends $536 per customer acquired, but your mileage will vary based on your target market, product complexity, and company maturity.
Focus on maintaining an LTV to CAC ratio above 3:1, aim for annual churn below 5% if you're established, and continuously optimize both retention and acquisition efficiency.
In the current economic environment, the companies that retain customers better than they acquire them will build the most sustainable and valuable businesses.